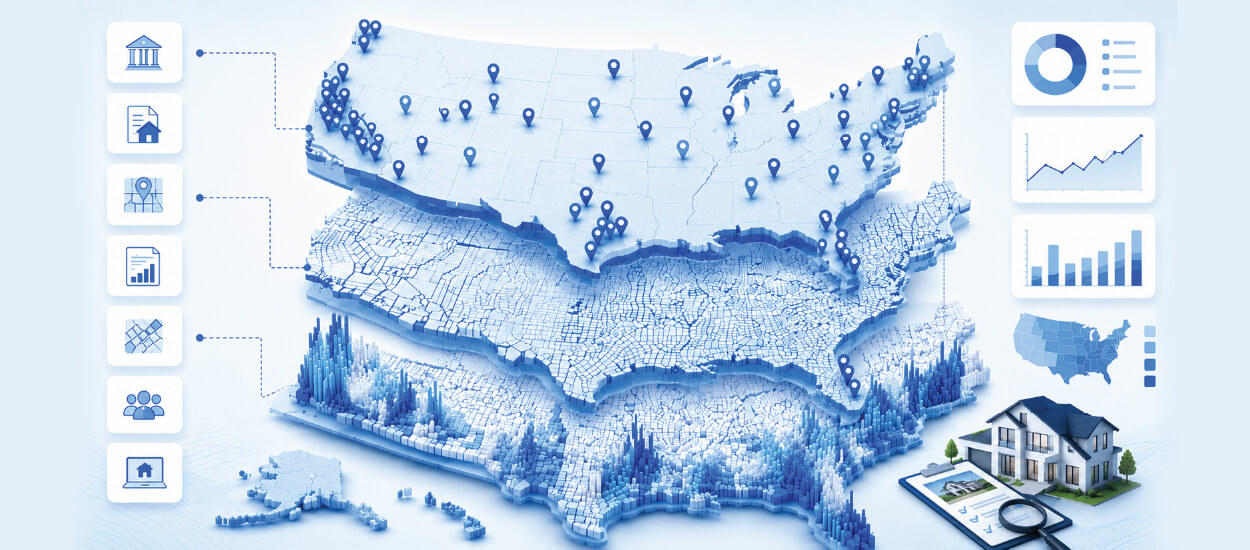
Real Estate Data Collection: 7 Free Public Sources For US Property Data
Snehal Joshi
June 26th, 202612 min read
The most reliable free public sources for US real estate data are: County assessor & recorder offices, City & county GIS portals, U.S. Census Bureau (ACS + American Housing Survey), FHFA House Price Index, State revenue / treasury & tax-lien records, Federal open-data portals (data.gov, HUD), Public listing aggregators, etc.
I have spent most of two decades building property datasets, and the question I hear most isn’t “where’s the data?” It’s “where’s the data I can actually trust, for free, that won’t fall apart the second I try to scale it?” Those are two very different questions, and most guides only answer the first one.
Free public sources are where US real estate data collection starts. They’re the baseline every commercial dataset gets measured against. If your paid product can’t beat what a county clerk gives away for nothing, you don’t really have a product. But “free” hides a lot of labor: scattered formats, update schedules that make no sense, and access rules that change from one county to the next.
What follows is the version of this guide I wish someone had handed me years ago. Not a link dump. A working map of the best free public sources for US real estate data, what each one is good for, how to get into it, and where it lets you down.
Why Public Sources Still Beat Paid Data for the Baseline
Government records carry something no aggregator can manufacture: legal authority. A recorded deed at the county isn’t a data point, it’s the document that decides who owns the house. Information on authority sites like the county recorder or the U.S. Census Bureau holds as legal truth until a court says otherwise. That is why even premium vendors trace their data back to these same public records.
For a data team, three things make these sources hard to do without. They’re authoritative, so you can validate scraped or purchased data against them. They cover the legal layer completely: ownership, liens, transfers, assessments. And they set the bar, because the value your commercial dataset adds is whatever it gives you beyond what’s already free. We get into this in more depth in our piece on how real estate data aggregation builds powerful marketplaces.
The catch most people miss. There is no national property database in the US. Records sit in roughly 3,000-plus county and local offices, each with its own system, format, and rules. The work was never finding the data. It’s reconciling thousands of versions of it into something consistent.
The 7 Free Sources, Ranked by What They’re Good For
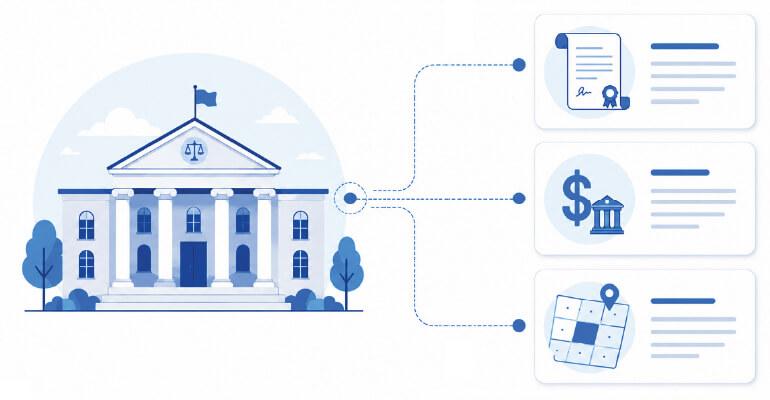
1. County assessor and recorder offices: the legal source of truth
What it is. Every county keeps two record sets that matter. The assessor values property for tax. The recorder (or clerk) registers deeds, mortgages, and liens. Between them you get ownership, assessed value, tax history, legal description, and recorded sale prices.
How to access it. Most counties run a free online property search, and larger ones offer bulk downloads or an API, sometimes for a small fee. Start at the county’s official .gov site. If you’re working across regions, a county directory helps you find the right office quickly.
Best for. Ownership checks, tax and assessment history, foreclosure and lien research, and the legal backbone of any property record. On one project our team pulled property records from 195 counties across three states for a Tennessee-based data provider. The hard part was never the data. It was that 195 counties meant something close to 195 different formats. If that’s the kind of volume you’re facing, our real estate data entry team handles exactly this.
Watch out for. Assessed value is not market value. Update timing varies: assessments are usually annual, new deeds land within days or weeks. And bulk-access policies are all over the map.
2. City and county GIS portals: the spatial layer
What it is. Geographic Information System portals publish parcel boundaries, zoning, land use, flood zones, and hazard layers as maps and downloadable shapefiles. This is the context that turns a list of addresses into a map you can actually reason about.
How to access it. Many municipalities run public ArcGIS or open-data GIS portals with direct shapefile and GeoJSON exports. Search “[county name] GIS open data.”
Best for. Parcel mapping, zoning and land-use analysis, flood and environmental overlays, and anything where location relationships matter more than ownership. Turning raw boundary files into clean, joined parcel data is its own discipline, which is why we offer dedicated parcel mapping services.
Watch out for. Coordinate systems and parcel-ID schemes differ between jurisdictions, so spatial joins across counties need real cleanup.
3. U.S. Census Bureau (ACS and American Housing Survey): market and demographic context
What it is. The Census Bureau is the backbone of US housing and demographic context. Two programs do most of the work. The American Community Survey (ACS) comes out every year and captures home values, rents, housing costs, utilities, housing age, and occupancy. The American Housing Survey (AHS), sponsored by HUD and run by the Census Bureau, is the most comprehensive national housing survey in the country, covering housing quality, costs, neighborhood conditions, and home-improvement activity.
How to access it. ACS data is free through data.census.gov. The AHS gives you a free Table Creator plus downloadable public-use microdata.
Best for. Market sizing, neighborhood profiling, rent and affordability analysis, and the demographic enrichment that makes a listing more than a price tag. If you want this layer stitched onto your existing records, that’s the heart of our property data enrichment services.
Watch out for. The AHS is collected roughly every two years, and its data model is shifting, with collection delayed into 2026 and beyond. Treat it as context, not a live signal. ACS estimates also carry margins of error at small geographies.
4. FHFA House Price Index: free price trends down to the ZIP code
What it is. The Federal Housing Finance Agency’s House Price Index (FHFA HPI) is a free set of repeat-sales price indexes built from tens of millions of home sales going back to the mid-1970s, across all 50 states and more than 400 cities. The part that matters most: it publishes down to the county, ZIP code, and census-tract level, which answers one of the questions data teams ask constantly. How have prices actually moved in this specific area?
How to access it. Free downloads at fhfa.gov, updated quarterly.
Best for. Historical price-trend analysis by small geography, market benchmarking, and sanity-checking home-value models. The FHFA’s “Expanded-Data” index even folds in sale prices sourced from county recorder offices, a nice reminder that the federal and county layers are stitched together.
Watch out for. This is an index of price change, not a feed of individual sale prices. And county-recorder coverage thins out in rural areas.
5. State revenue, treasury, and tax-lien records: the distressed-property layer
What it is. State and county treasury offices publish property tax records, delinquency lists, and tax-lien and tax-deed sales. This is where distressed and investment inventory surfaces before it reaches the open market.
How to access it. County treasurer and tax-collector sites. Many states post delinquency and tax-sale lists on a fixed annual calendar.
Best for. Foreclosure and pre-foreclosure pipelines, investor lead generation, and wealth and affordability signals at the neighborhood level.
Watch out for. Tax-sale rules are state-specific and time-sensitive. These lists go stale fast
6. Federal open-data portals (data.gov, HUD): bulk datasets
What it is. data.gov catalogs hundreds of thousands of government datasets, and HUD publishes housing-program, fair-market-rent, and assisted-housing data. These are your bulk, machine-readable, license-friendly sources.
How to access it. Direct CSV and API downloads from data.gov and huduser.gov.
Best for. Programmatic ingestion, national-scale enrichment, and anything you need in a clean, documented format. When the volume gets serious, this is where our real estate data scraping services do the heavy lifting.
Watch out for. Freshness and granularity vary a lot between datasets. Always read the documentation before you trust a field.
7. Public listing aggregators: active inventory and asking prices
What it is. Public portals and MLS aggregators show active listings, asking prices, photos, and listing attributes. This is the only layer that reflects what’s on the market right now.
How to access it. Public browsing, and some sites offer limited APIs. Licensed MLS access needs a brokerage relationship. If you’re aggregating at scale, our MLS data aggregation service is built for exactly this.
Best for. Current inventory, asking-price signals, and listing-level attributes.
The one legal line to respect. Government records are public and free to use. Listing-portal and MLS data usually isn’t. It’s often restricted by terms of service and licensing even when anyone can see it. Treat the listing layer as licensed, not public, unless you’ve confirmed otherwise.
Comparison Table: Coverage, Freshness, and Format
If you take one thing from this guide, take this table. It’s the mental model I use when deciding which source answers which question.
Source
Best for
Update Cadence
Format
Free?
County Assessor & Recorder
Ownership, sales, tax, liens (legal truth)
Deeds: days–weeks; assessments: annual
Web, some bulk/API
Yes*
City/County GIS
Parcels, zoning, flood/hazard layers
Periodic
Shapefile, GeoJSON
Yes
Census ACS & AHS
Values, rents, demographics, housing stock
ACS annual; AHS ~biennial
Tables, CSV, microdata
Yes
FHFA HPI
Price trends by ZIP/tract/county
Quarterly
CSV, tables
Yes
State/County Tax & Lien Records
Distressed & investment inventory
Annual calendar / rolling
Lists, PDFs, web
Yes
data.gov / HUD
Bulk national datasets
Varies
CSV, API
Yes
Listing Aggregators
Active inventory, asking prices
Real-time
Web, limited API
Licensed
*Some counties charge a nominal fee for bulk downloads.
How to Actually Collect the Data (A Workflow That Survives Scale)
Knowing the sources is the easy part. Turning them into a usable dataset is where projects quietly die. Here’s the sequence that holds up.
Start from the legal layer. Pull ownership, sales, and tax records from county assessor and recorder offices first. This is your spine. Everything else attaches to it.
Add spatial context. Join GIS parcel and zoning layers so each record carries boundaries, land use, and hazard flags.
Enrich with market and demographic data. Layer in Census ACS/AHS and FHFA HPI for value, rent, and trend context.
Normalize ruthlessly. Different counties spell the same field five different ways. Standardize addresses, parcel IDs, and value fields before you do anything analytical. This step is most of the real work.
Schedule by cadence, not by habit. Re-pull deeds weekly, assessments annually, FHFA quarterly. Matching your refresh schedule to each source’s real update rhythm is what keeps a database honest.
Where Free Public Data Breaks Down
I’d be doing you a disservice if I pretended free sources were enough on their own. They aren’t. Here’s exactly where they crack.
Fragmentation. Thousands of counties, no national standard. Coverage is uneven, and rural counties are often the weakest links.
Access friction. Rate limits, CAPTCHAs, and inconsistent bulk policies make large-scale collection slow and brittle. What works for one county breaks on the next.
Update lag. Some records refresh daily, others once a year, and the schedule often comes down to one county administrator’s workload. Completeness is genuinely hard to guarantee.
Format chaos. PDFs, scanned documents, watermarked pages, bespoke web tables. Extraction turns into an engineering problem fast.
This is the gap where a dedicated data operation earns its keep. At Hitech BPO we aggregate property data from more than 1,000 small and mid-size MLS and third-party sources, using scheduled crawlers and custom extraction to pull features and geocoded data even from awkward public sites, then normalize and clean it against industry standards. The value isn’t access to the sources. It’s getting thousands of inconsistent sources to behave like one. You can see the full scope of our real estate support services if you want the bigger picture.
Drowning in county formats? Tell us which states and counties you need, and we’ll scope a clean, normalized property dataset for you.
For free price trends by ZIP code, use the FHFA House Price Index, which publishes repeat-sales indexes down to the ZIP and census-tract level back to the mid-1970s. For the actual recorded sale prices on individual homes, go to the county recorder or clerk office where the property sits, since recorded deeds are the legal record of each sale.
Automated valuation models are built mainly from county assessor and recorder records (assessed values, tax history, recorded prices), MLS and listing feeds, and public indexes like the FHFA HPI and Census housing data, usually with a proprietary model layered on top.
Yes. Ownership records, assessments, tax rolls, and most government housing statistics are public records, free to access and use. The constraints come from each site’s terms of use and rate limits, and from listing or MLS data, which is often contractually restricted even when it’s publicly visible.
It depends on the source. County recorder data updates within days to weeks of a transaction, assessments update annually, ACS releases yearly, and the AHS roughly every two years. Because the cadences differ, a usable database blends several sources rather than leaning on one.
Combine the legal layer (county records) with GIS for location and listing sources for current attributes and imagery, then run scheduled extraction with strong normalization. At real scale most teams either build a dedicated crawling-and-cleaning pipeline or outsource it, because per-county quirks make ad-hoc scraping fragile.
Outsource your real estate data collection. Bring scale, speed, and accuracy to your property data operations.
Snehal Joshi spearheads the business process management vertical at Hitech BPO, an integrated data and digital solutions company. Over the last 20 years, he has successfully built and managed a diverse portfolio spanning more than 40 solutions across data processing management, research and analysis and image intelligence. Snehal drives innovation and digitalization across functions, empowering organizations to unlock and unleash the hidden potential of their data.
What’s next? Message us a brief description of your project. Our experts will review and get back to you within one business day with free consultation for successful implementation.
Disclaimer:
HitechDigital Solutions LLP and Hitech BPO will never ask for money or commission to offer jobs or projects. In the event you are contacted by any person with job offer in our companies, please reach out to us at info@hitechbpo.com
To provide the best experiences, we use technologies like cookies to store and/or access device information. Consenting to these technologies will allow us to process data such as browsing behavior or unique IDs on this site. Not consenting or withdrawing consent, may adversely affect certain features and functions.
Functional
Always active
The technical storage or access is strictly necessary for the legitimate purpose of enabling the use of a specific service explicitly requested by the subscriber or user, or for the sole purpose of carrying out the transmission of a communication over an electronic communications network.
Preferences
The technical storage or access is necessary for the legitimate purpose of storing preferences that are not requested by the subscriber or user.
Statistics
The technical storage or access that is used exclusively for statistical purposes.The technical storage or access that is used exclusively for anonymous statistical purposes. Without a subpoena, voluntary compliance on the part of your Internet Service Provider, or additional records from a third party, information stored or retrieved for this purpose alone cannot usually be used to identify you.
Marketing
The technical storage or access is required to create user profiles to send advertising, or to track the user on a website or across several websites for similar marketing purposes.